Discount!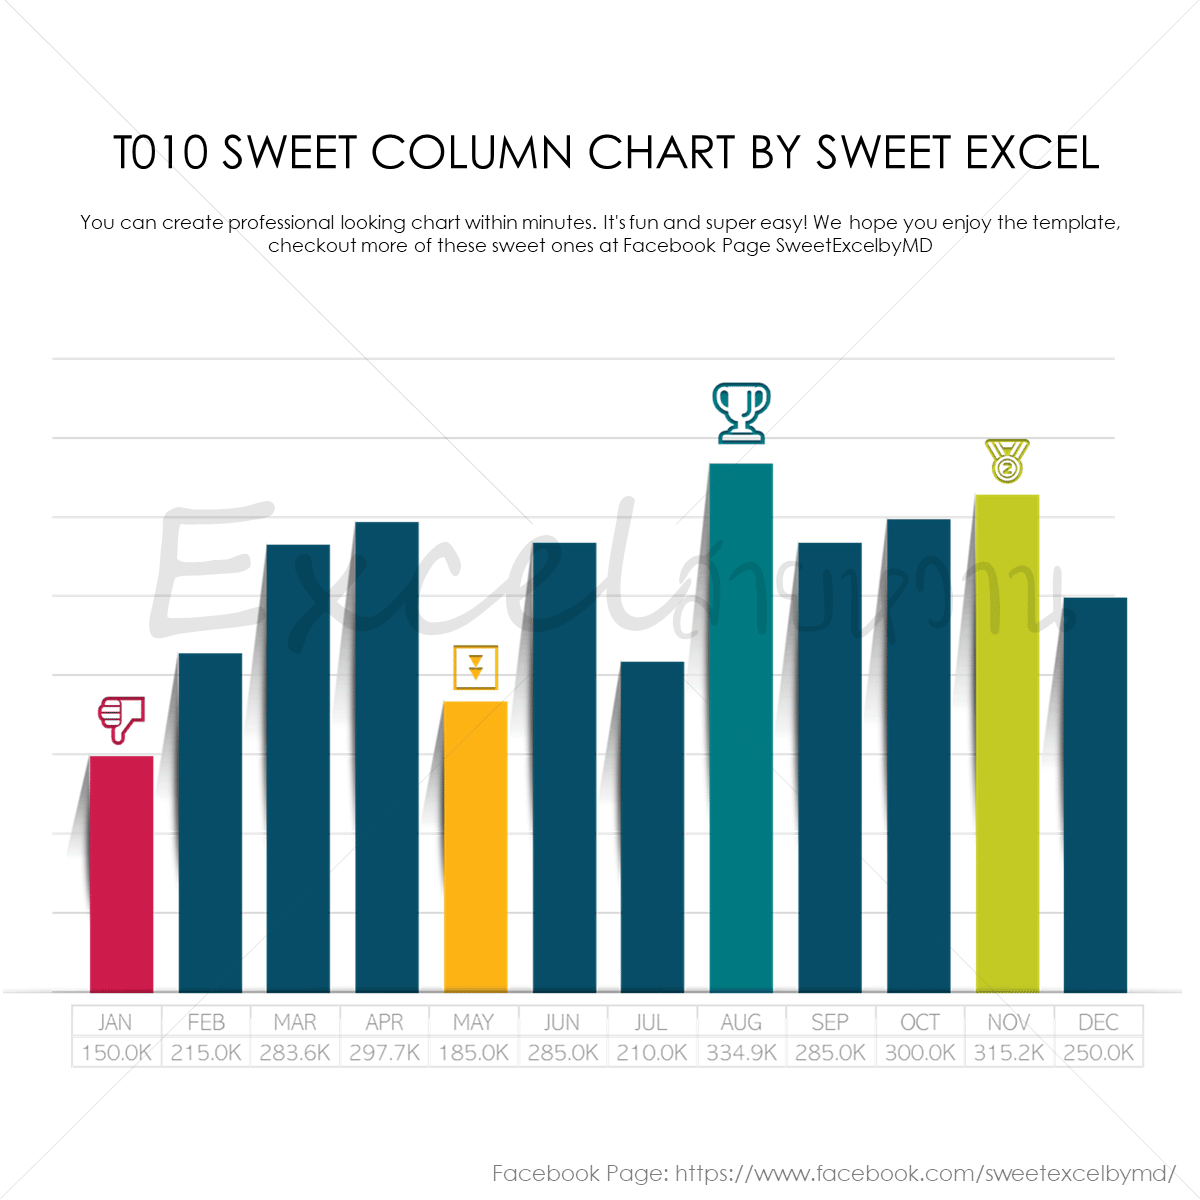

 Creating Excel Chart
Automatic Template T010 Column Chart showing the highest and lowest values in difference colors
This chart is created to display 2 highest and 2 lowest values in difference color than the rest of the chart. When entering data, the colors will change and the icons will automatically move according to the values. You can choose to change the color and change the icon. Suitable for 1-12 Column chart as shown in the picture (maximum is 12 columns, cannot increase the number of columns).
1. Graph automatically adjusted according to input numbers
2. Change input format (Number, Currency, Percentage)
3. Label and Data Table change automatically according to the input
4. Graph and Icon colors change automatically according to the input data
5. Hide/Change Icon
6. Add/remove graphs automatically according to the input
7. Move different parts of the graph conveniently by pressing buttons
8. Change the chart color and change back to the default color conveniently by pressing buttons
9. Add images and icons
10. Copy all charts and paste them into PowerPoint or other programs.
11. In addition to the automatic buttons, able to unlock to move or modify parts of the graph as needed.
*Suitable for Advance users only, please proceed carefully as it may cause an error.
1. Compatible with Microsoft Excel Desltop Version 2013 and above.
2. File contain VBA (Macro), have to enable Macro in order to use the template.
3. The graph may move slightly depending on each computer setting/specification. This can be fixed simply by moving the object as usual method.
4. If the computer does not have the font that is set in the template, the display on your screen will not match the picture 100%. If you are not sure about the font, you can inquire font name by email or Facebook page: sweetexcelbymd. However, most of our templates use the font that comes with Microsoft Office 365.
You may also like…
-
Discount!
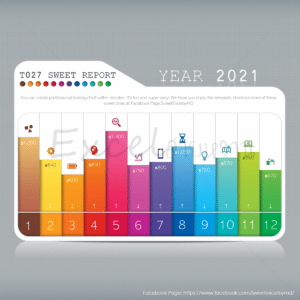
T027 Sweet Column Chart
Original price was: ฿179.00.฿159.00Current price is: ฿159.00. Add to cart -
Discount!
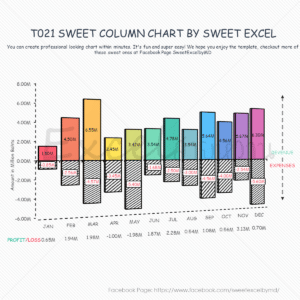
T021 Sweet Column Chart
Original price was: ฿179.00.฿159.00Current price is: ฿159.00. Add to cart -
Discount!
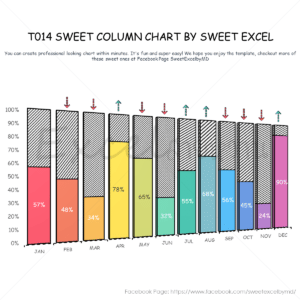
T014 Sweet Column Chart
Original price was: ฿179.00.฿159.00Current price is: ฿159.00. Add to cart
Related products
-
Discount!
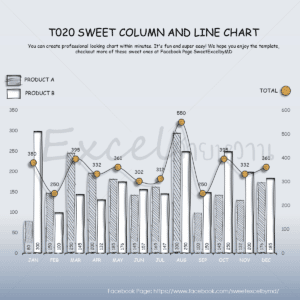
T020 Sweet Combo Chart
Original price was: ฿179.00.฿159.00Current price is: ฿159.00. Add to cart -
Discount!
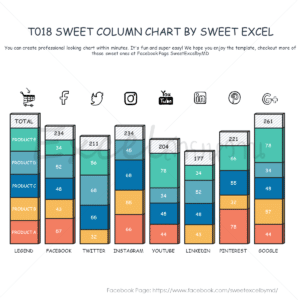
T018 Stacked Column Chart
Original price was: ฿179.00.฿159.00Current price is: ฿159.00. Add to cart -
Discount!
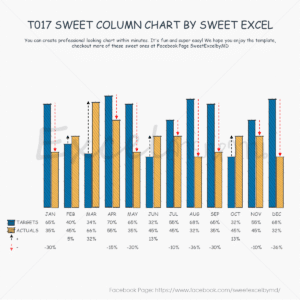
T017 Sweet Column Chart
Original price was: ฿179.00.฿159.00Current price is: ฿159.00. Add to cart -
Discount!
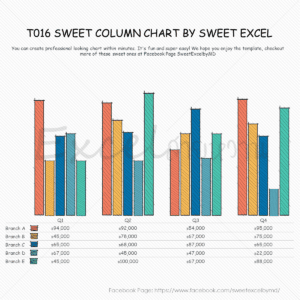
T016 Column Chart
Original price was: ฿179.00.฿159.00Current price is: ฿159.00. Add to cart -
Discount!
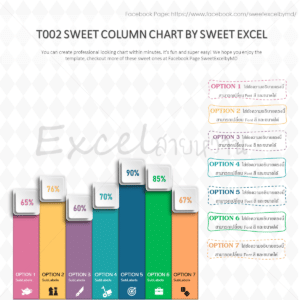
T002 Sweet Column Chart
Original price was: ฿179.00.฿159.00Current price is: ฿159.00. In Cart