Bar Graph in Excel
Automatic Template T005 suitable for 1-7 Bar chart as shown in the picture (maximum is 7 bars, cannot increase the number of bars).
1. Graph automatically adjusted according to input numbers.
2. Change input format (Number, Currency, Percentage).
3. Label and Sub-label change automatically according to the input.
4. Hide Icon, Textbox, Data Label, Sub Label.
5. Add/remove graphs automatically according to the input.
6. Move different parts of the graph conveniently by pressing buttons.
7. Change the chart color and change back to the default color conveniently by pressing buttons.
8. Fill gradient color in the Label box.
9. Change the color of the back chart.
10. Swap color palettes left and right which effect color swap on the graph.
11. Change the color of the back chart to the selected color (same with font chart color) or white.
12. Change the logo color tone, light/dark.
13. Change the color tone of the Data Label, light/dark
14. Change the color tone of the Sub Label, light/dark.
15. Add images and icons
16. Copy all charts and paste them into PowerPoint or other programs.
You may also like…
-
Discount!

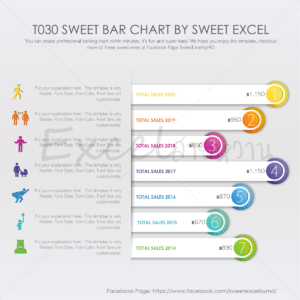
T030 Sweet Bar Chart
Original price was: ฿179.00.฿159.00Current price is: ฿159.00. Add to cart -
Discount!
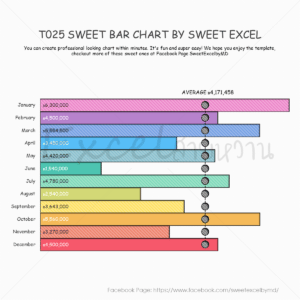
T025 Sweet Bar Chart
Original price was: ฿179.00.฿159.00Current price is: ฿159.00. Add to cart -
Discount!
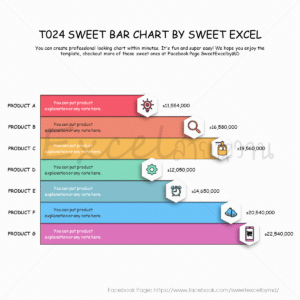
T024 Sweet Bar Chart
Original price was: ฿179.00.฿159.00Current price is: ฿159.00. Add to cart
Related products
-
Discount!
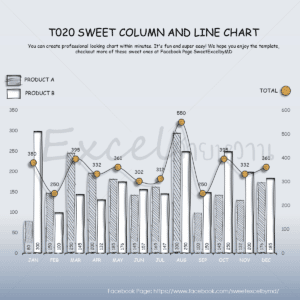
T020 Sweet Combo Chart
Original price was: ฿179.00.฿159.00Current price is: ฿159.00. Add to cart -
Discount!
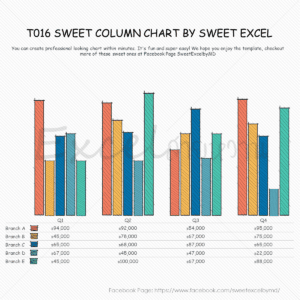
T016 Column Chart
Original price was: ฿179.00.฿159.00Current price is: ฿159.00. Add to cart -
Discount!
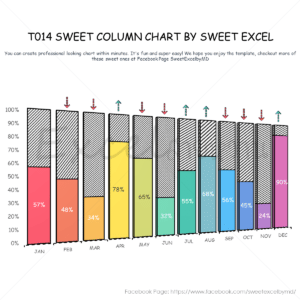
T014 Sweet Column Chart
Original price was: ฿179.00.฿159.00Current price is: ฿159.00. Add to cart -
Discount!
T007 Sweet Column Chart
Original price was: ฿179.00.฿159.00Current price is: ฿159.00. Add to cart -
Discount!
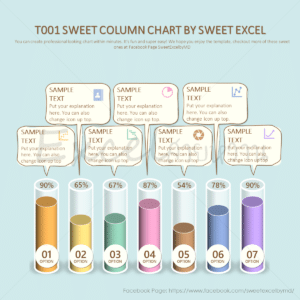
T001 Sweet Column Chart
Original price was: ฿179.00.฿159.00Current price is: ฿159.00. Add to cart